
UK Corporate Interest Coverage Ratios Are Also Set to Collapse. Does it Matter?
Introduction: We previously outlined that European non-financial corporate (NFC) interest coverage ratios are set to fall sharply in the coming years if current rates persist. The UK is no different. This short piece seeks to explore some of the data points around this emerging risk and as importantly, who is more likely to lose money on these loans?
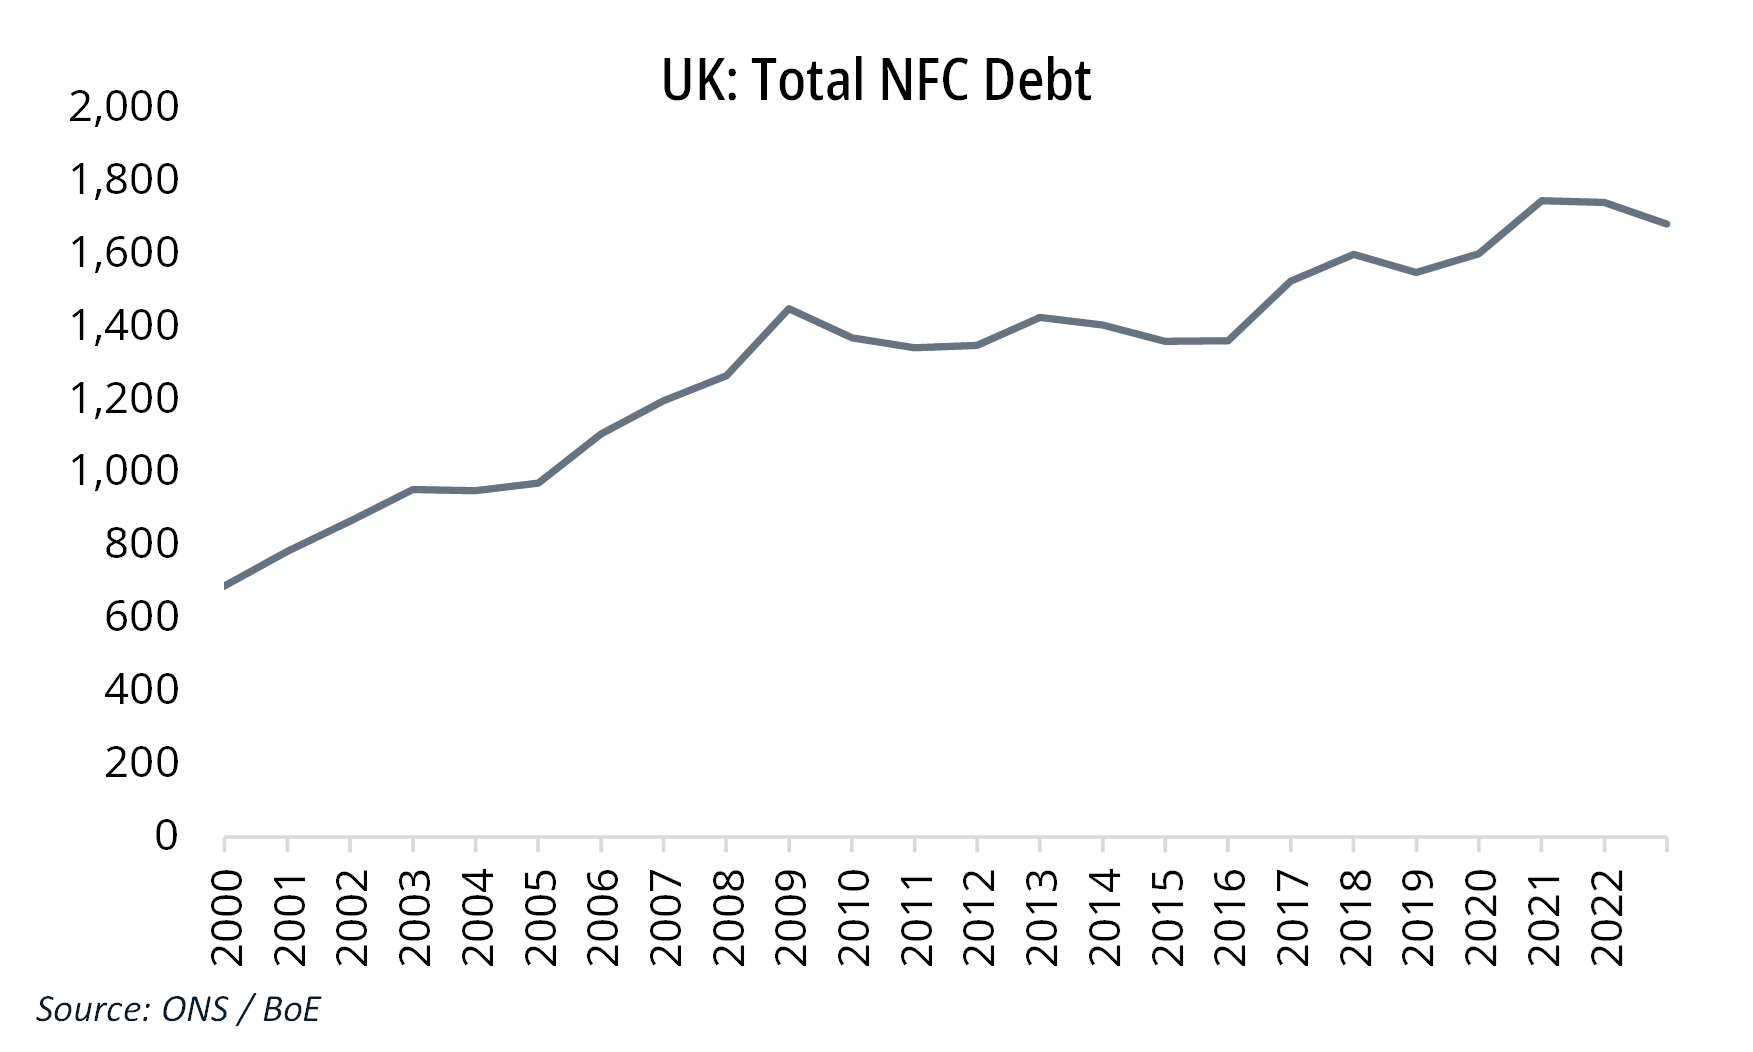
Like many of its peers, the UK has spent most of the past decade in an era of low-interest rates, supported by quantitative easing from the Bank of England. Non-financial corporates have been incentivised to increase their debt levels, while investors have been pushed from government bonds into corporate bonds in a search for yield. This led to four important outcomes:
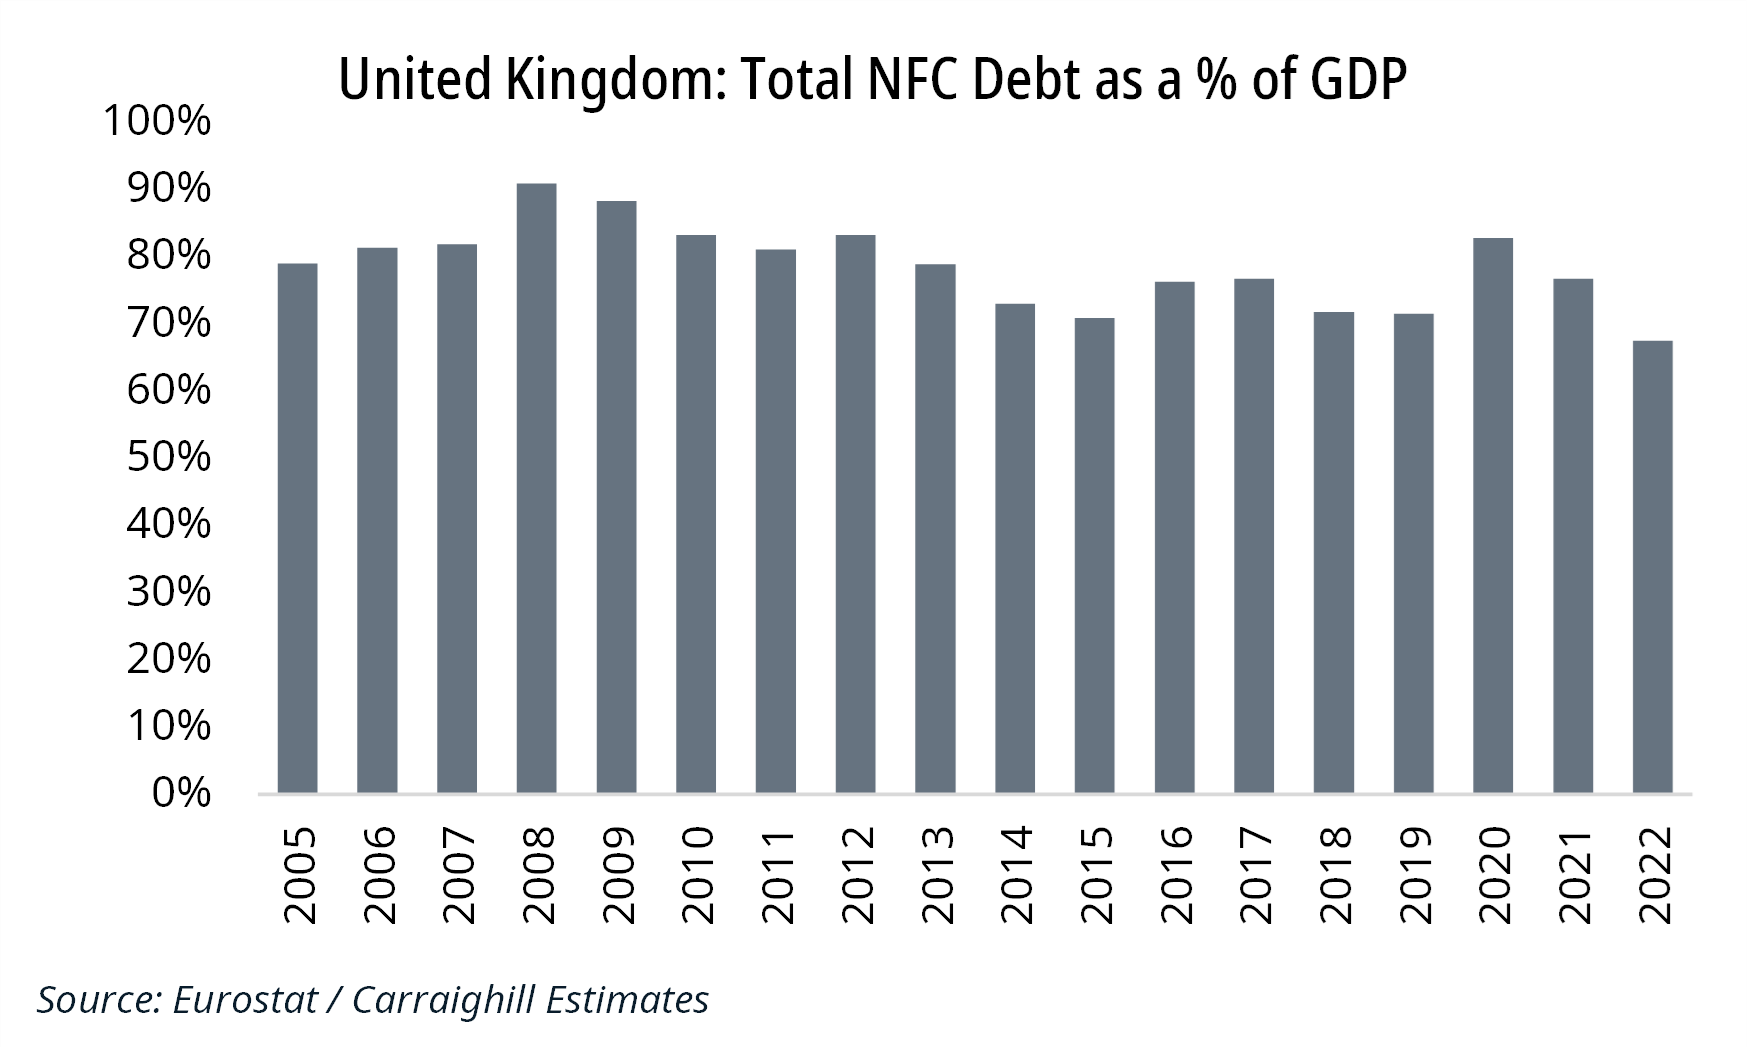
- Rising debt (negative): This increased by 23% from £1.37trn in 2009 to £1.68trn today. However, as a share of GDP, it declined from 88% in 2009 to 67% in 2022.
- The Banks lost market share: The bank’s share of this debt is currently 32% (down from 37% in 2011). It lost its share to the bond market, overseas banks, and private credit agencies.
- Falling interest rates (positive): The rate paid peaked in 2007 at 5.7%. It fell to 1.9% by Q1 2022. In absolute terms, the amount of interest paid was £77bn in 2008. It declined to £34bn in 2021 (-56%). This was a very negative backdrop for UK banks.
- Rising corporate profits (positive): Gross operating surplus (EBITDA equivalent) increased from c. £300bn in 2007/08 to £444bn by the end of 2022 (+48%).
Because of these developments, the UK interest coverage ratio rose after the Global Financial crisis from 3.9x in 2008 to 12.2x in 2022. The question is, did this introduce complacency into credit underwriting standards in the later years?


If back book rates rise 500bps from Q1 2023 to Q1 2026 and gross operating surplus increases 4% YoY, then the coverage ratio should fall to 4.2 at this time. We note that front-book bank loan rates are already +400bps. The bond market is slower to re-price, but this will happen.
The last time coverage ratios were this low was in 2008. Corporate insolvencies should now rise (these generally occur with a lag). As you can see from the graph below, compulsory liquidations are correlated with interest coverage ratios. Total liquidations are already above the 2008 level.
In terms of lending by domestic banks, we note:
- NFC lending as a share of total private sector bank loans is 25% currently.
- Of this, 64% is to large corporates and 36% to SMEs.
- The three largest areas of domestic bank NFC exposure are real estate (34%), professional, scientific, and technical services (10.1%), and wholesale and retail trade (10.1%). Commercial real estate is therefore c. 9% of total bank exposure.


Conclusion: Our work on historical crisis periods in the UK (see prior blog) leads us to believe that UK rates will need to remain more elevated than peers for an extended period (the UK is running twin deficits and struggling to grow real GDP per capita). We believe these deteriorating interest coverage ratios will ultimately translate into higher-than-expected losses and insolvencies.
But this credit risk is potentially not exclusive to the banking sector this time around. The question is, who now owns the debt, and who is most exposed?
This is a topic we have reviewed internally at the stock-specific level as we perform detailed analysis on around 50 European/ Eastern European/ Brazilian/ Scandinavian/ Mexican banks, private equity, payment, and asset management firms.

If you would like to access our work, Carraighill Research Access enables you to access these and other thematic and sectoral research through our secure online portal. It also gives you access to investment ideas across the banks, payments, fintech, asset management, and real estate sectors for European and select emerging markets. If you would like to speak to a partner or analyst on the topics raised in this piece, you can contact us here.
