
The Italian Productivity Puzzle
In April, Carraighill published “Italy: The Matrix”. The product provides a full reconciliation of the total economy across key areas. It offers a clear view of a country’s longer-term structural and shorter-term cyclical investment themes. This should help us identify actionable ideas while also having a greater appreciation for sector-specific earnings risk in each security. The Matrix product also covers Germany, Sweden, Poland, and France. More countries will be covered in time.
Throughout the 2010s, Italy suffered from low growth. The average wage has lagged behind other European countries, as the economy is slow to transition towards professional services. The industrial structure is uncompetitive with limited productivity growth. The difference in GDP per capita between Italy and Germany continues to rise. Four issues cause this:
- An ageing population
- High savings & negative net investment
- Low productivity growth
- Restricted government expenditure
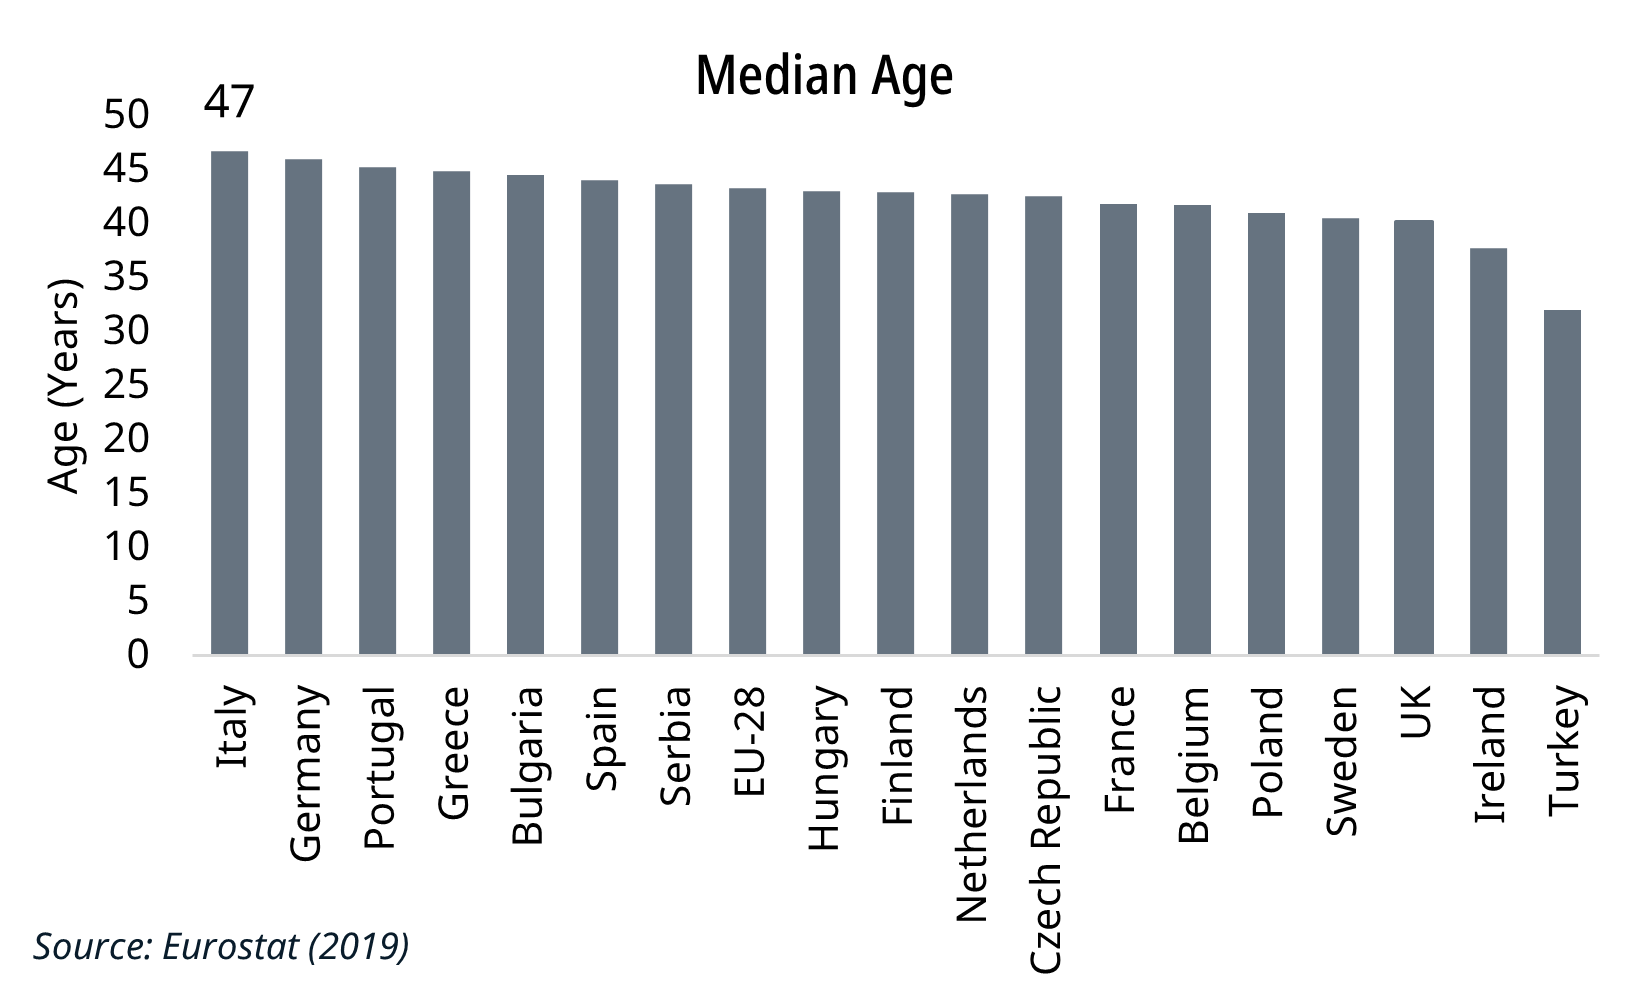
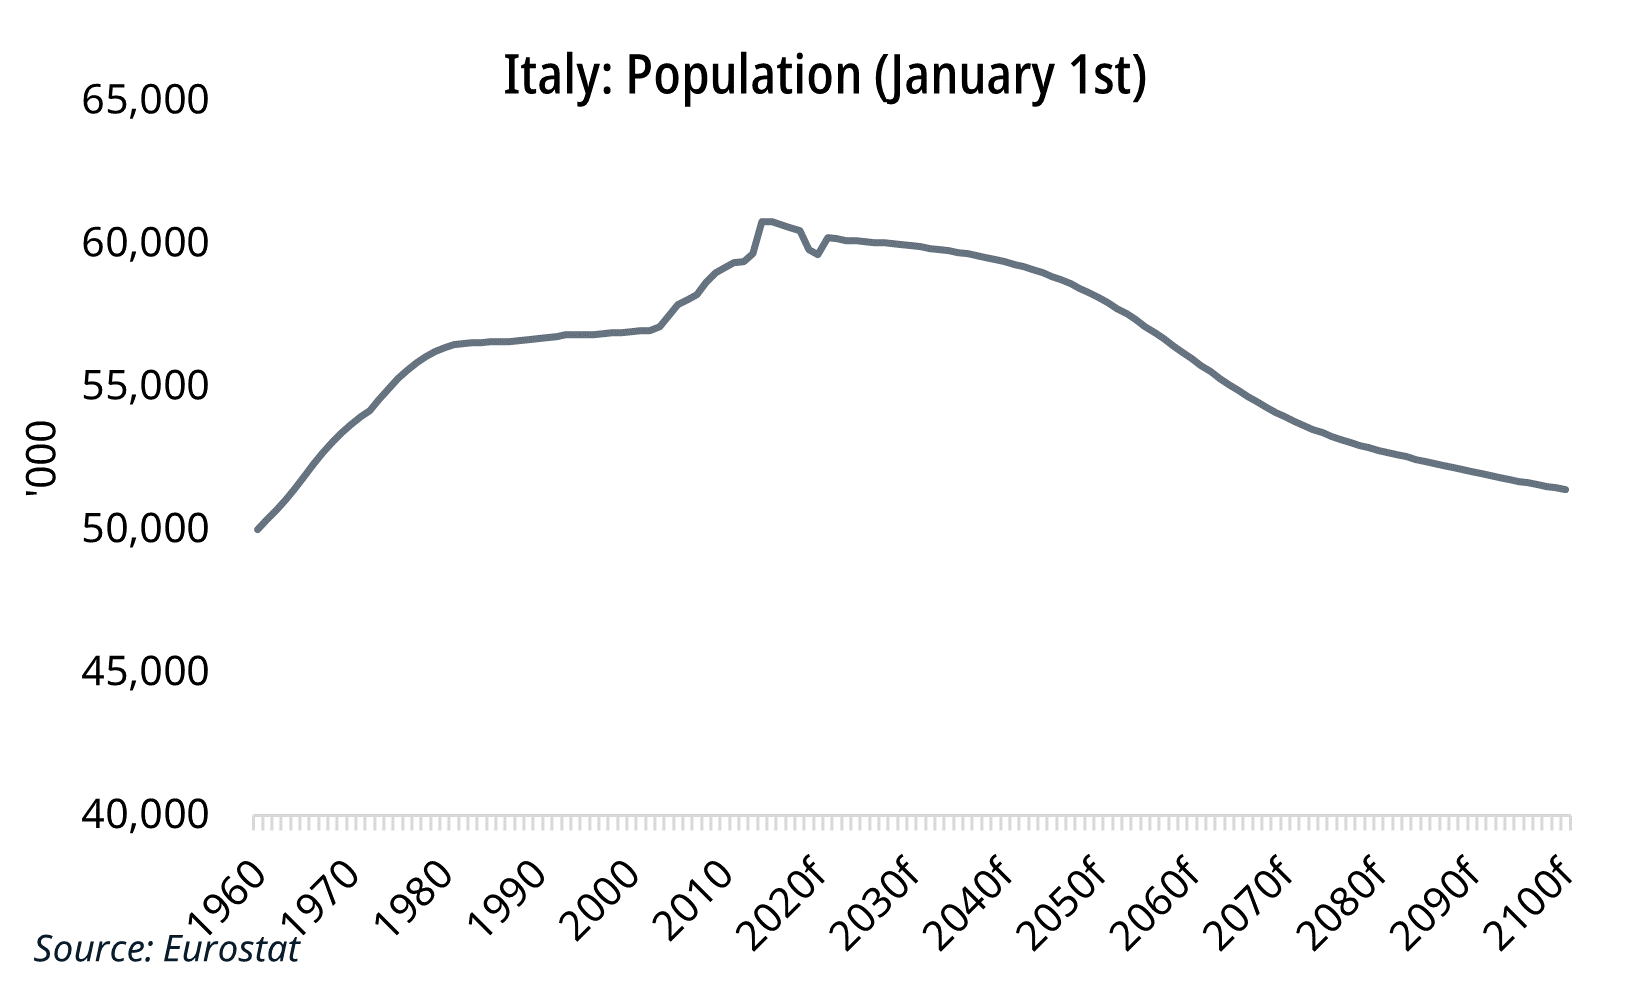
An Ageing Population
Italy’s population is now falling, having peaked close to 60m between 2015 and 2020. It is expected to decline close to 50m by the end of the century. Inward migration is not sufficient to offset the falling birth rate. Despite immigration of c.2% of total population in 2013, it has remained close to 0% since. Italian citizens are the oldest in the EU, with a median age close to 50. The old-age dependency is now above 35% and rising. The house buying age (25-44 years old) peaked at 30% of the total population in 2008 and is now falling towards 20%.
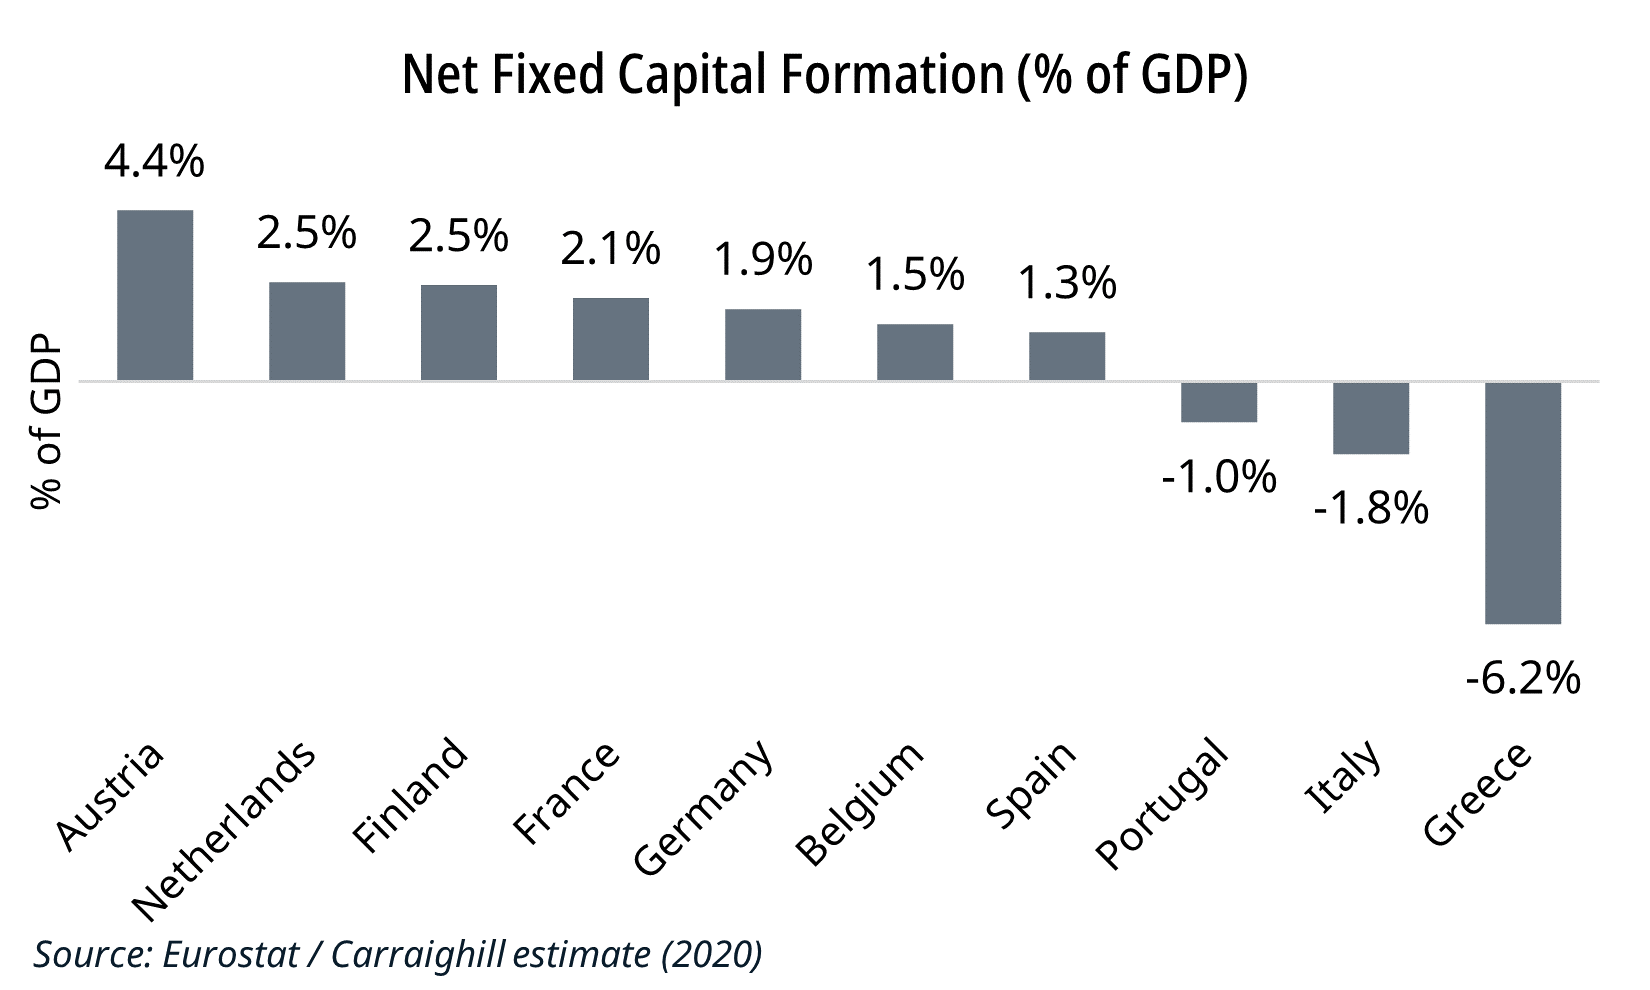
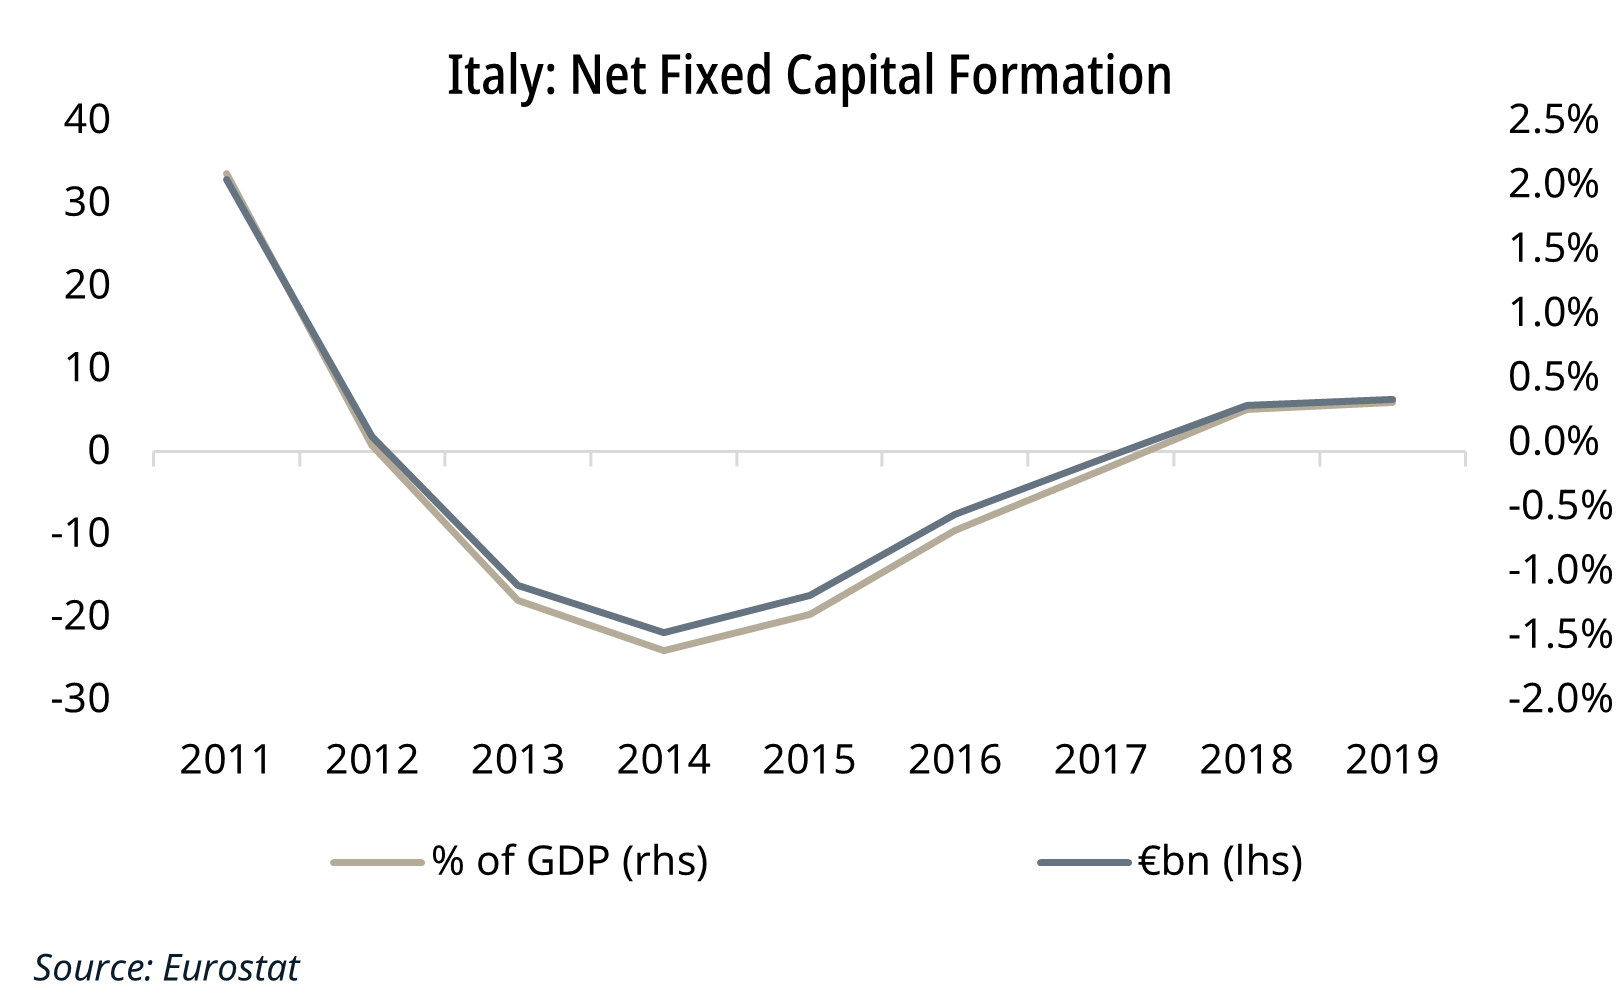
High Savings & Negative Net Investment
Older populations are characterised by lower investment and higher savings. This is evident in Italy, with gross savings close to 7% of GDP.
Net investment (capital expenditure less depreciation) was negative following the euro crisis of 2012. It has also only returned positive in recent years. Investment in dwellings and other structures has declined as a share of GDP and is likely to fall further as the population ages. This surplus of savings will continue to flow abroad due to the limited investment opportunities domestically. The total economy net capital stock has plateaued, while as a share of GDP, it has fallen from 365% to close to 320%.
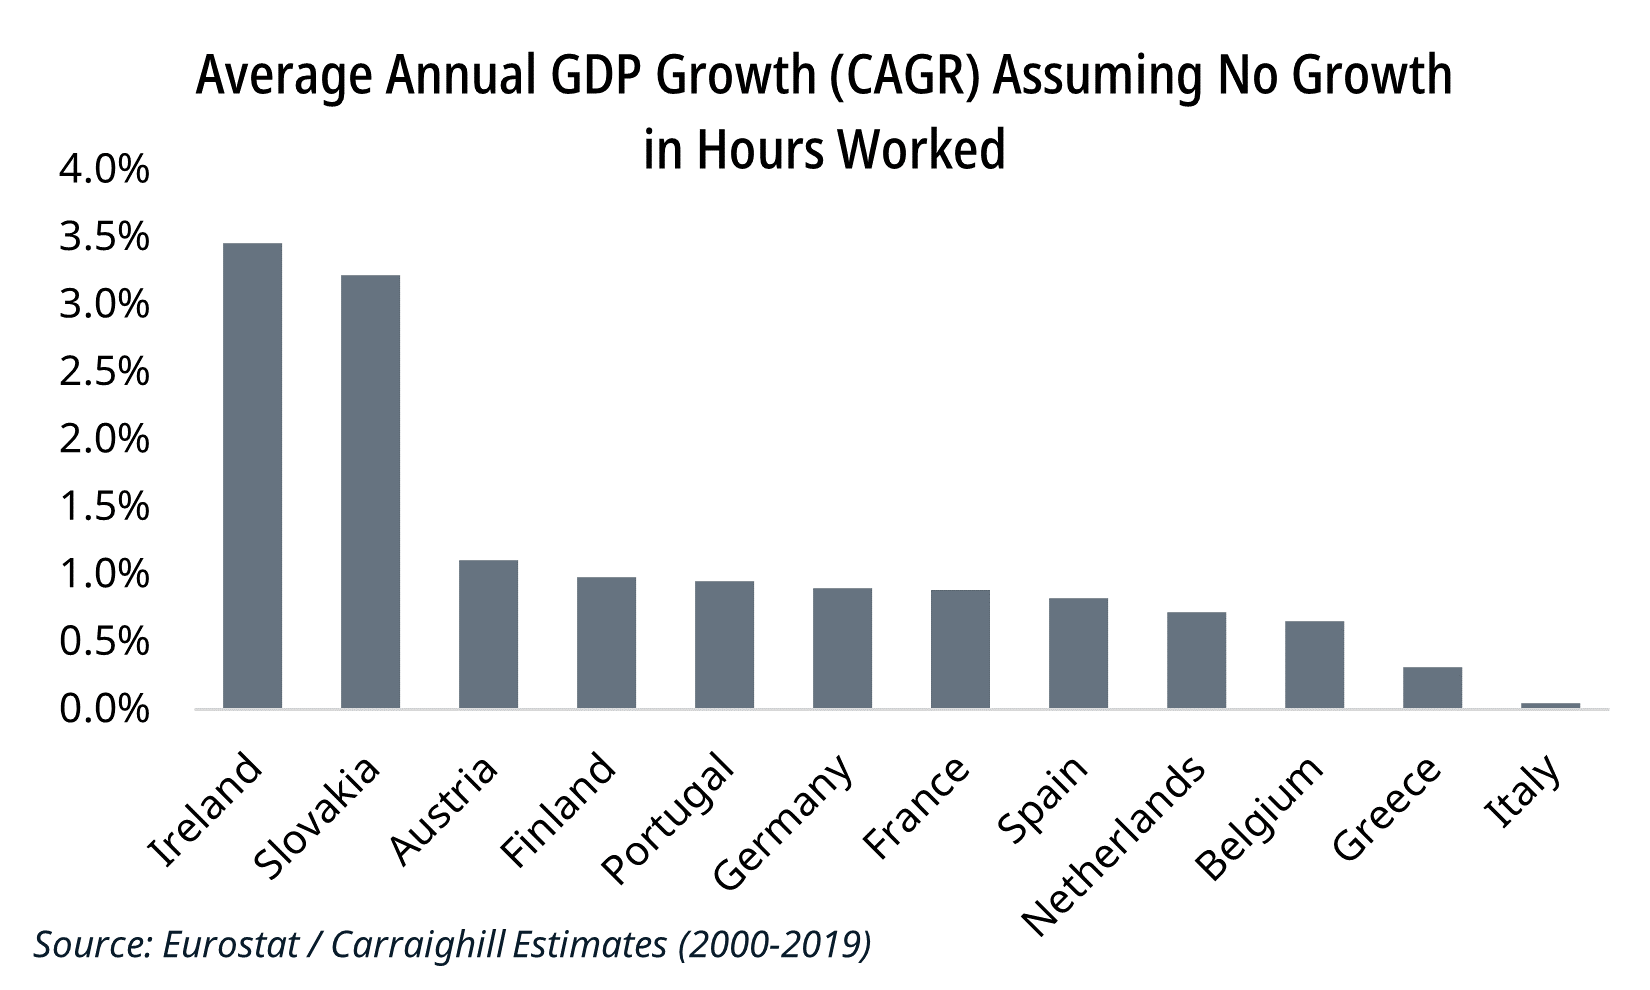
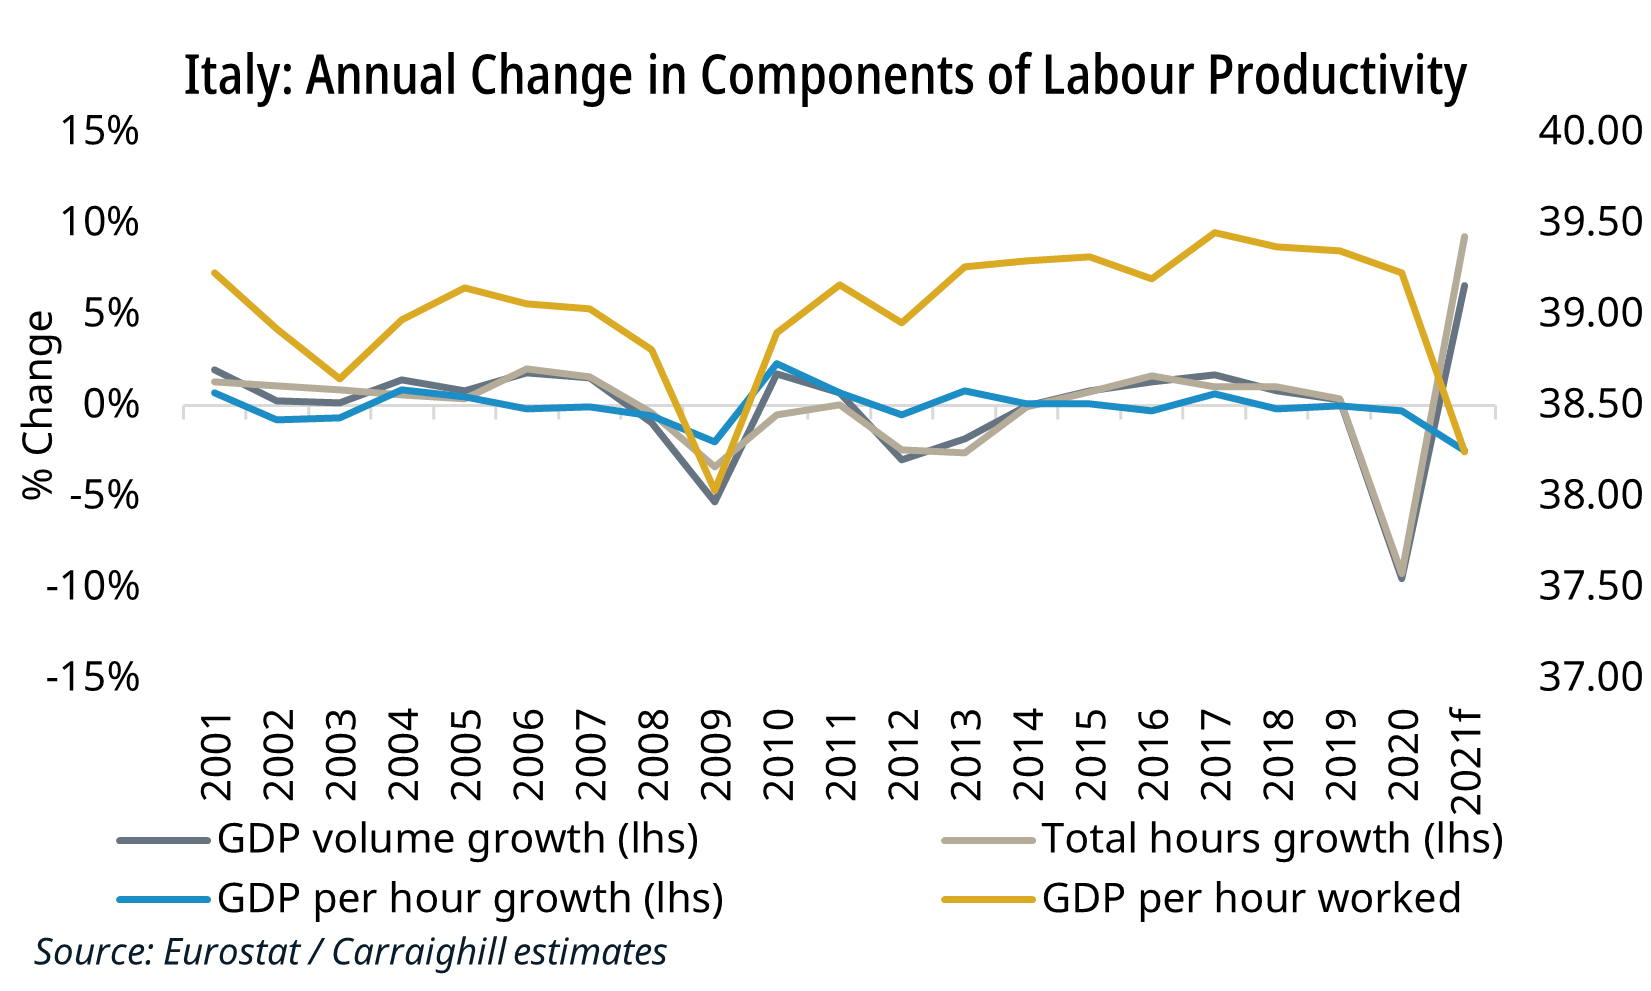
Low Productivity Growth
This is the most significant drag on GDP growth. Productivity defined by GVA per hour worked increased by close to 25% since 2000, compared to nearly 70% in Germany and France. GDP per employee has fallen gradually since peaking in 2007.
Italian productivity has declined for many large industries such as construction, tourism, health care, and professional services since 2000. Manufacturing and retail trade productivity increased by over 20% in this same period.
Other notable drags on productivity include:
- Ineffective government interventions (spending and regulation).
- Difficulty in accessing financing.
- Inability to attract and retain talent.
- Limited internet availability.
- High debt levels
- Low spending on education.
- Minimal R&D expenditure.
Systemic failures will continue to hinder future GDP and productivity growth.
Restricted Government Expenditure
Italian public debt has been a problem for decades due to the large deficits in the 1980s. In this period, the Bank of Italy and Treasury were one institution where the Central Bank would purchase the outstanding bonds. Inflation was high. Following the oil crisis in the late 1970s, inflation was over 20%.
As part of the European Monetary System (EMS) in the 1990s, the lira had to be kept stable. This led to establishing an independent Central Bank and the hiking of rates to tame inflation and limit lira volatility before euro currency adoption.
Indeed, when inflation fell back close to 5% through the 1990s, the Central Bank maintained its high-rate preference to attract external financing. Despite running primary surpluses from the mid-1990s onwards, real rates remained high. This legacy debt, as well as an unwillingness to reform, continues to hinder economic growth today.
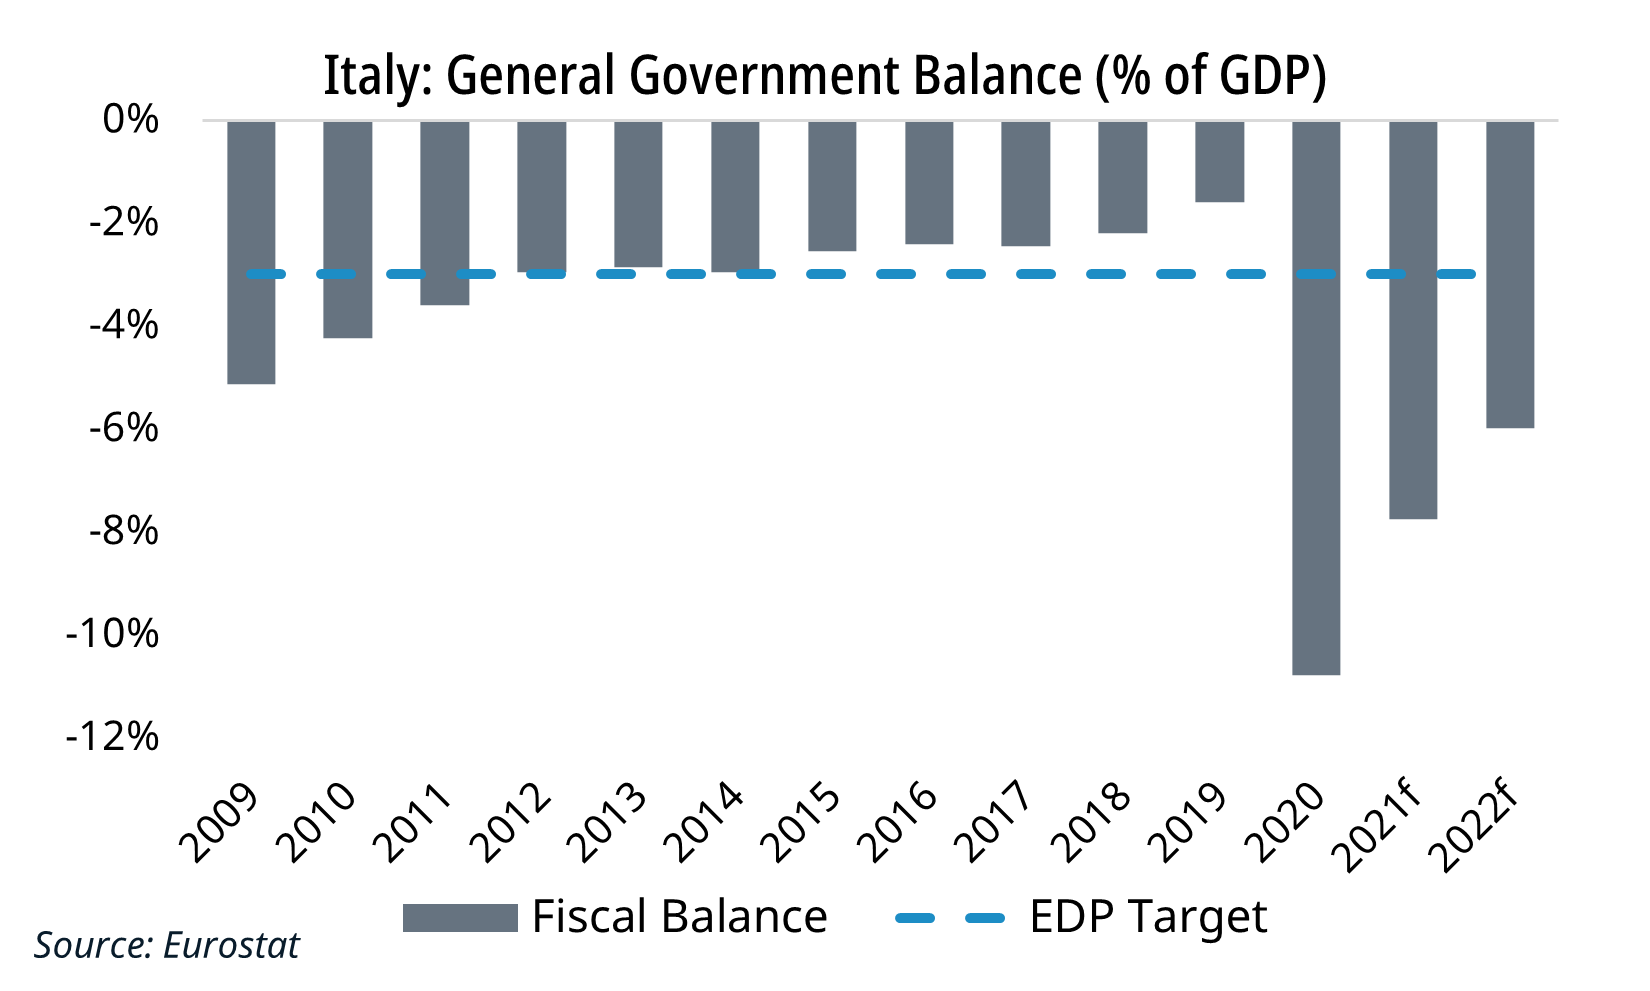
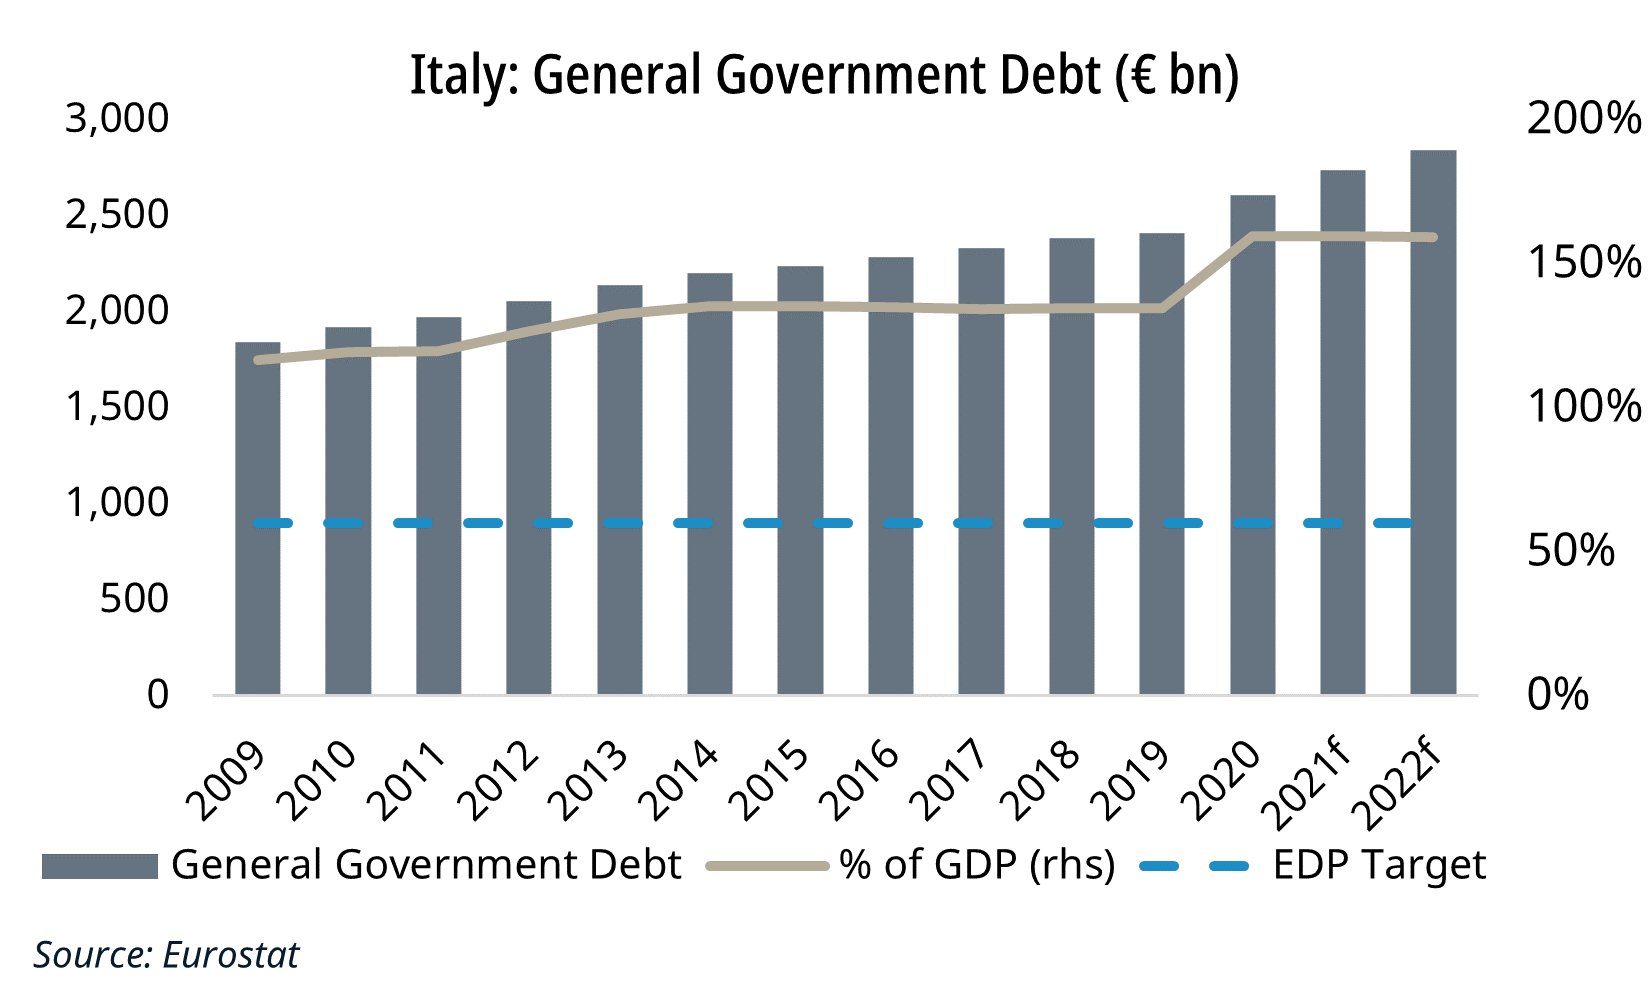
Public debt is forecast to exceed 150% of GDP in 2020. At the same time, average rates on government debt are among the highest in the Euro Area. These elevated repayment costs have negated the primary surpluses over the last decade.
Tight austerity measures reduced government expenditure, and net public investment was negative throughout the last decade. Deteriorating infrastructure has slowed GDP growth.
Conclusion
There are positives for the Italian economy. Its share of global exports has increased over the past 5 years. Italy runs a modest current account surplus, and private sector debt is low. Historically low yields on government debt now provide a valuable opportunity for the Italian economy. Both domestic and EU fiscal supports should propel the recovery further. But the structural flaws are difficult to overcome unless more systemic reforms are introduced. This remains politically challenging.
To date, neither the political left nor centre has succeeded. More extreme solutions (euro exit) continue to be discreetly discussed, albeit outside the leadership of the main political parties. Italy now relies on Mario Draghi to install these reforms and address the shortcomings of previous governments.
From an investment perspective, the excess savings in Italy continue to flow into asset management products. This is positive for these firms. The banks continue to struggle with low rates and a legacy of unproductive industries.
If you would like to access the reports mentioned in this article, Carraighill Research Access enables you to access these and other thematic and sectoral research reports through our secure online portal. If you would like to speak to a partner or analyst on the topics raised in this piece, you can contact us here.
