
The Challenge Facing European Shopping Centres
The European Shopping Centre (SC) market has expanded over the past two decades from 74 million m² in 2002 to close to 169 million m² at end 2020 (+128%). There are several longer-term influences on build space and rental growth. These include population change, urbanization, infrastructure development, rising wages, convenience, growing disposable income, and GDP as a share of household wealth per capita. All should induce a rise in retail spending within an economy that is increasingly consumer driven. Shopping centres generally cater for this desire, especially the discretionary consumer element, which is driven by younger shoppers.
However, challenges persist to their longer-term outlook due to slowing population growth and an ageing demographic. In addition, the transition online remains a significant and growing headwind. This was accelerated during COVID-19. This piece explores three key issues in more detail. How it evolves has clear implications for many of the large-listed retail REITs.

Market Structure and Size in Europe:
The rise in shopping centre space in Europe can be segregated into:
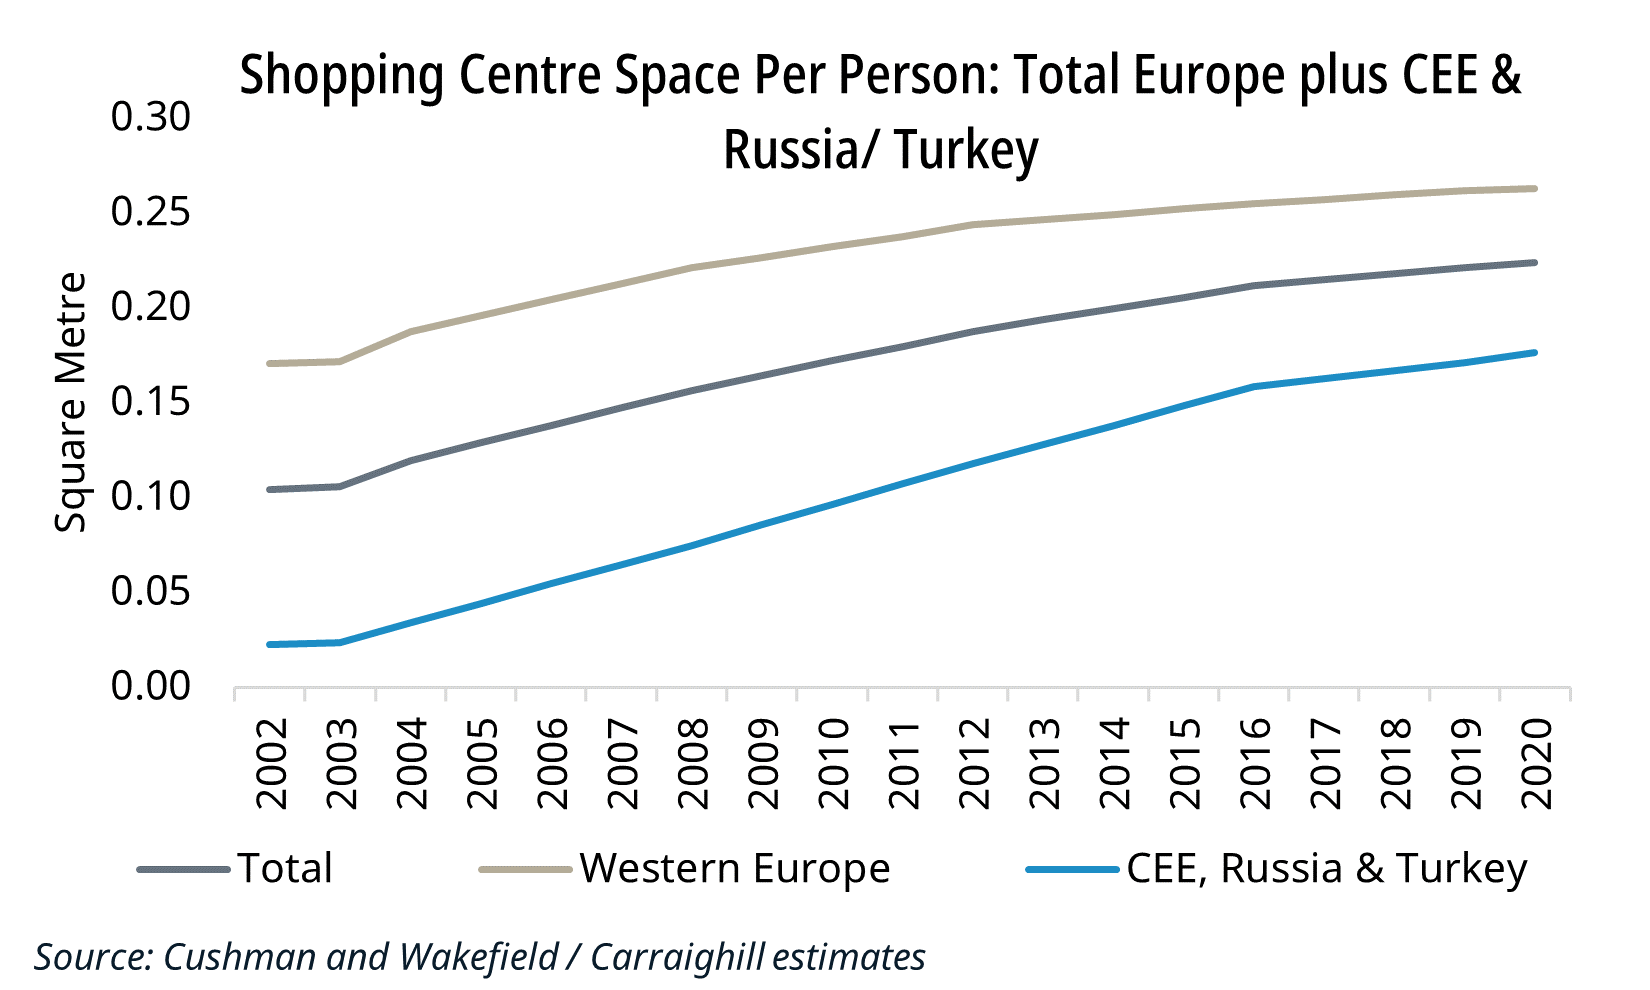
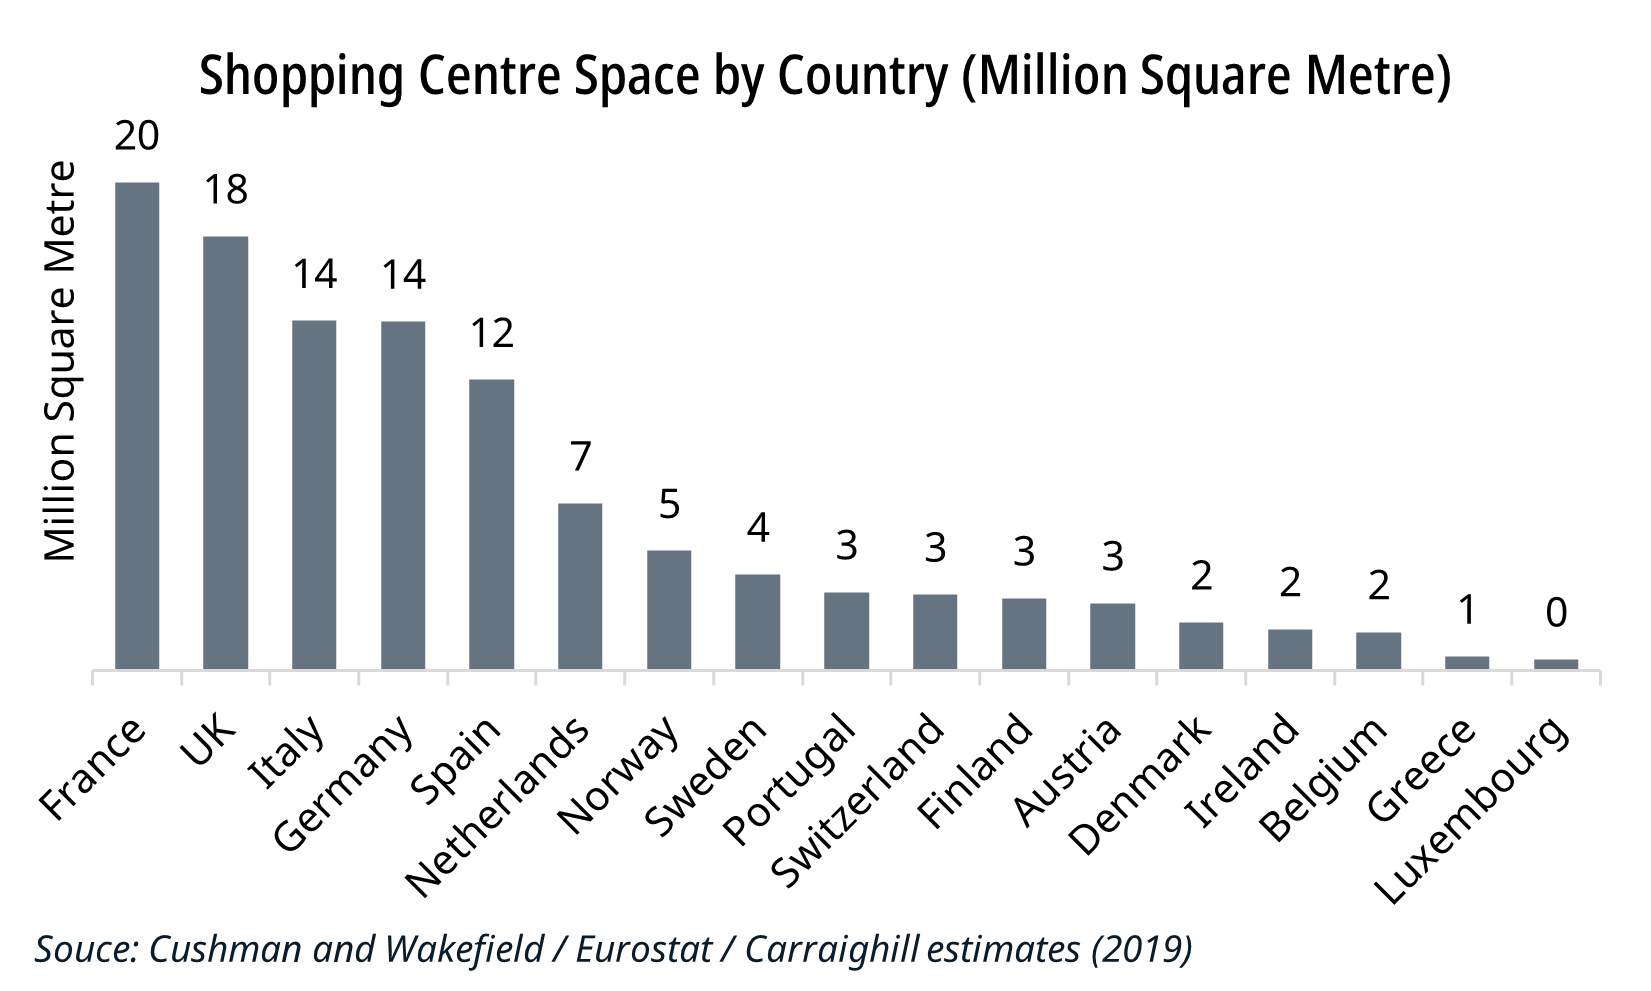
Western Europe (WE): Total square footage at end 2020 is expected to be 112 million m² (+67% since 2002). The larger economies of France, Spain, Germany, Italy, and the UK account for 70% of this total and an equivalent share of new build over this period. On a per-capita basis, available space per person is now 0.26m², up from 0.17m² in 2002. This has expanded around 55% faster than the underlying demographics. In addition, there is a gradual movement of spend online, which has clearly accelerated during the pandemic.

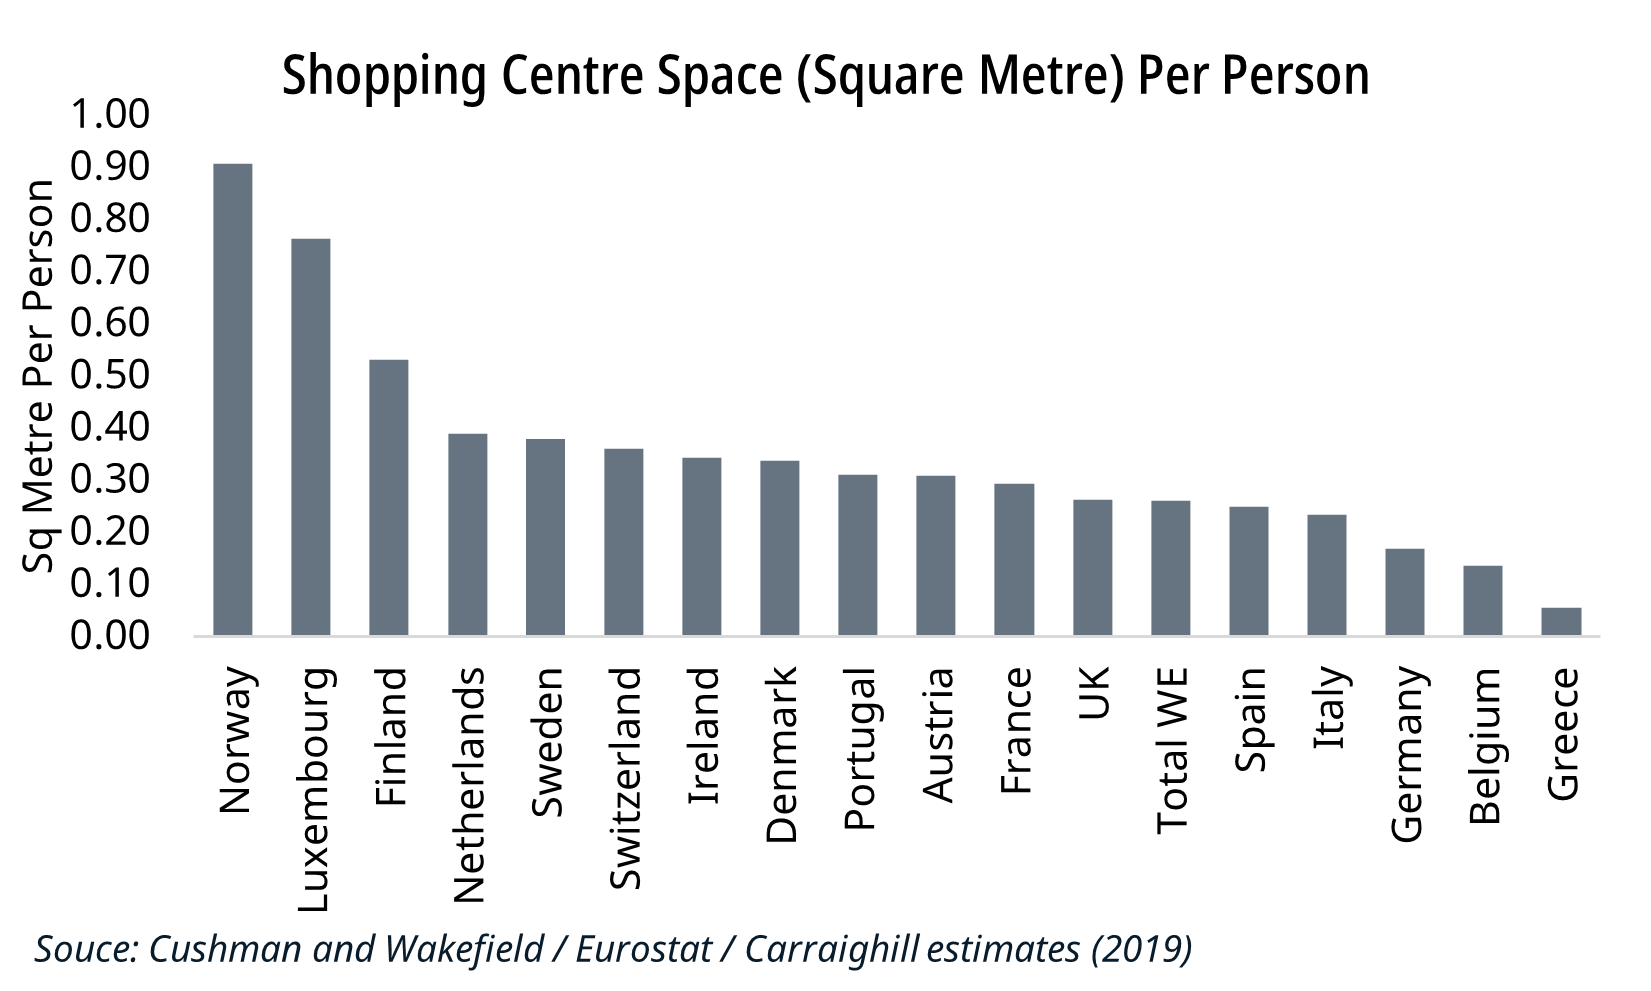
CEE (incl Russia and Turkey): The total SC area in this region has risen even quicker, from 7 million m² to 57 million m². This is primarily due to developments in Russia, Turkey, and Poland. These three regions now represent 84% of total space (up from 69% in 2002). However, the expansion is even more rapid on a per capita basis, up from 0.02m² per person to 0.18m². Although below the level of WE, with challenging demographics (ex-Turkey), it suggests potential saturation in this region (especially as consumption per capita is also weaker). In particular, Poland and Czechia now have similar space per person as the average WE country at c. 0.26m² per person. Turkey, Russia, Hungary and Romania lag at close to 0.15m² per capita.
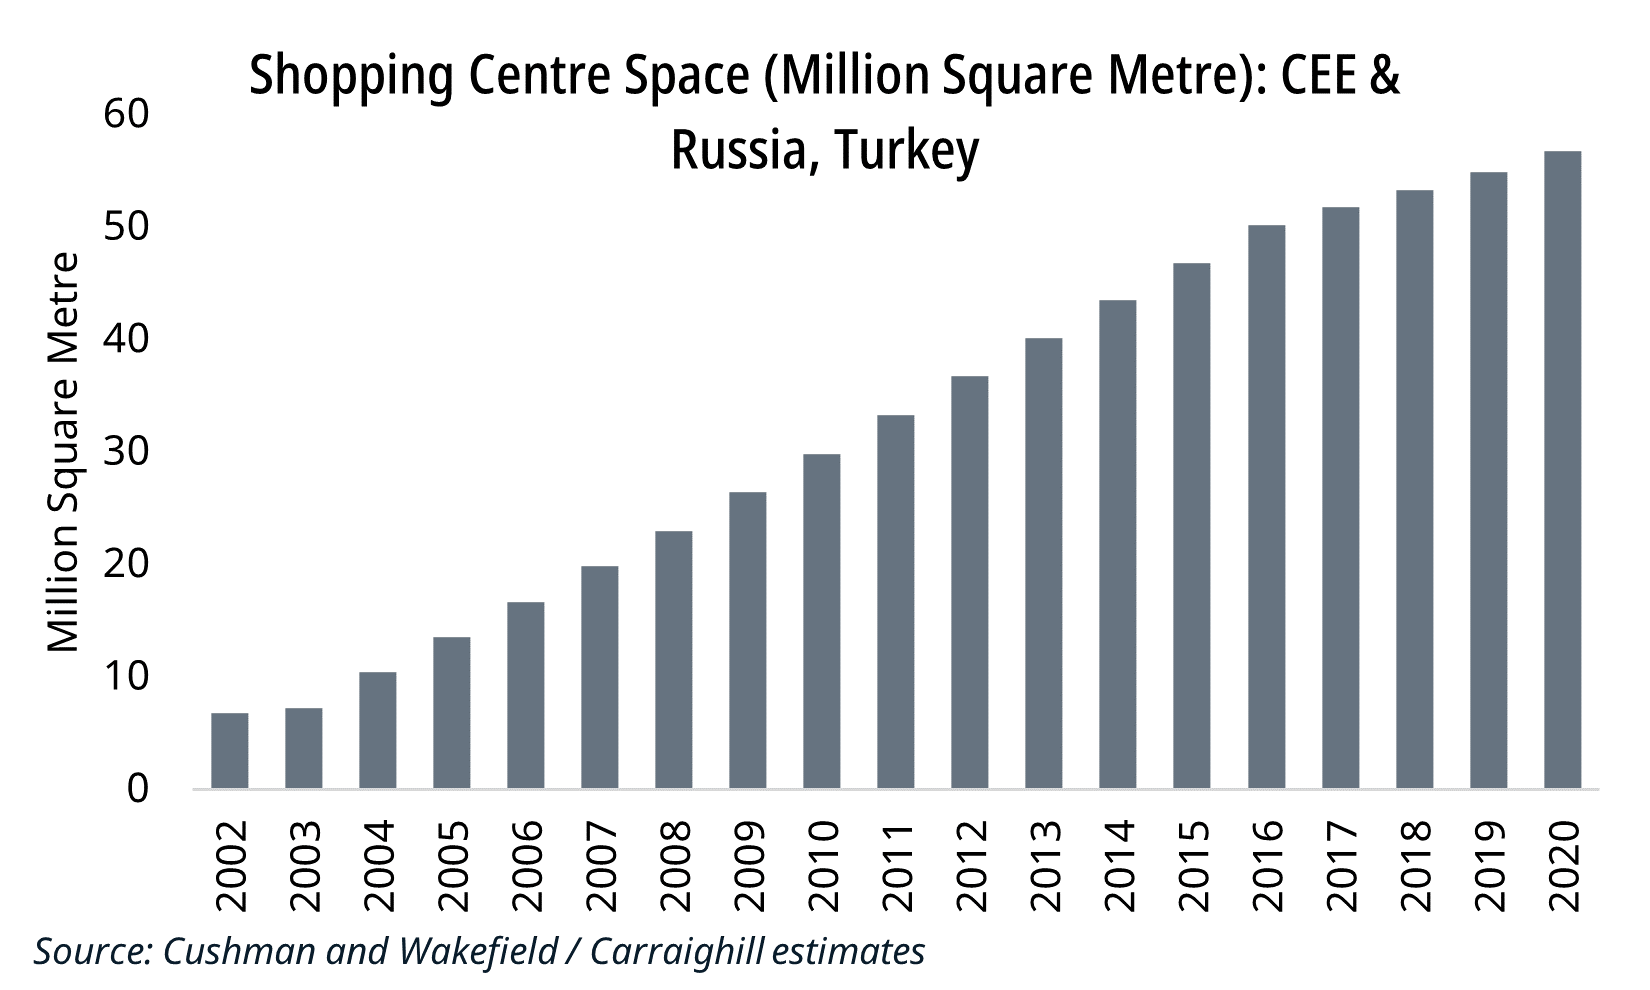
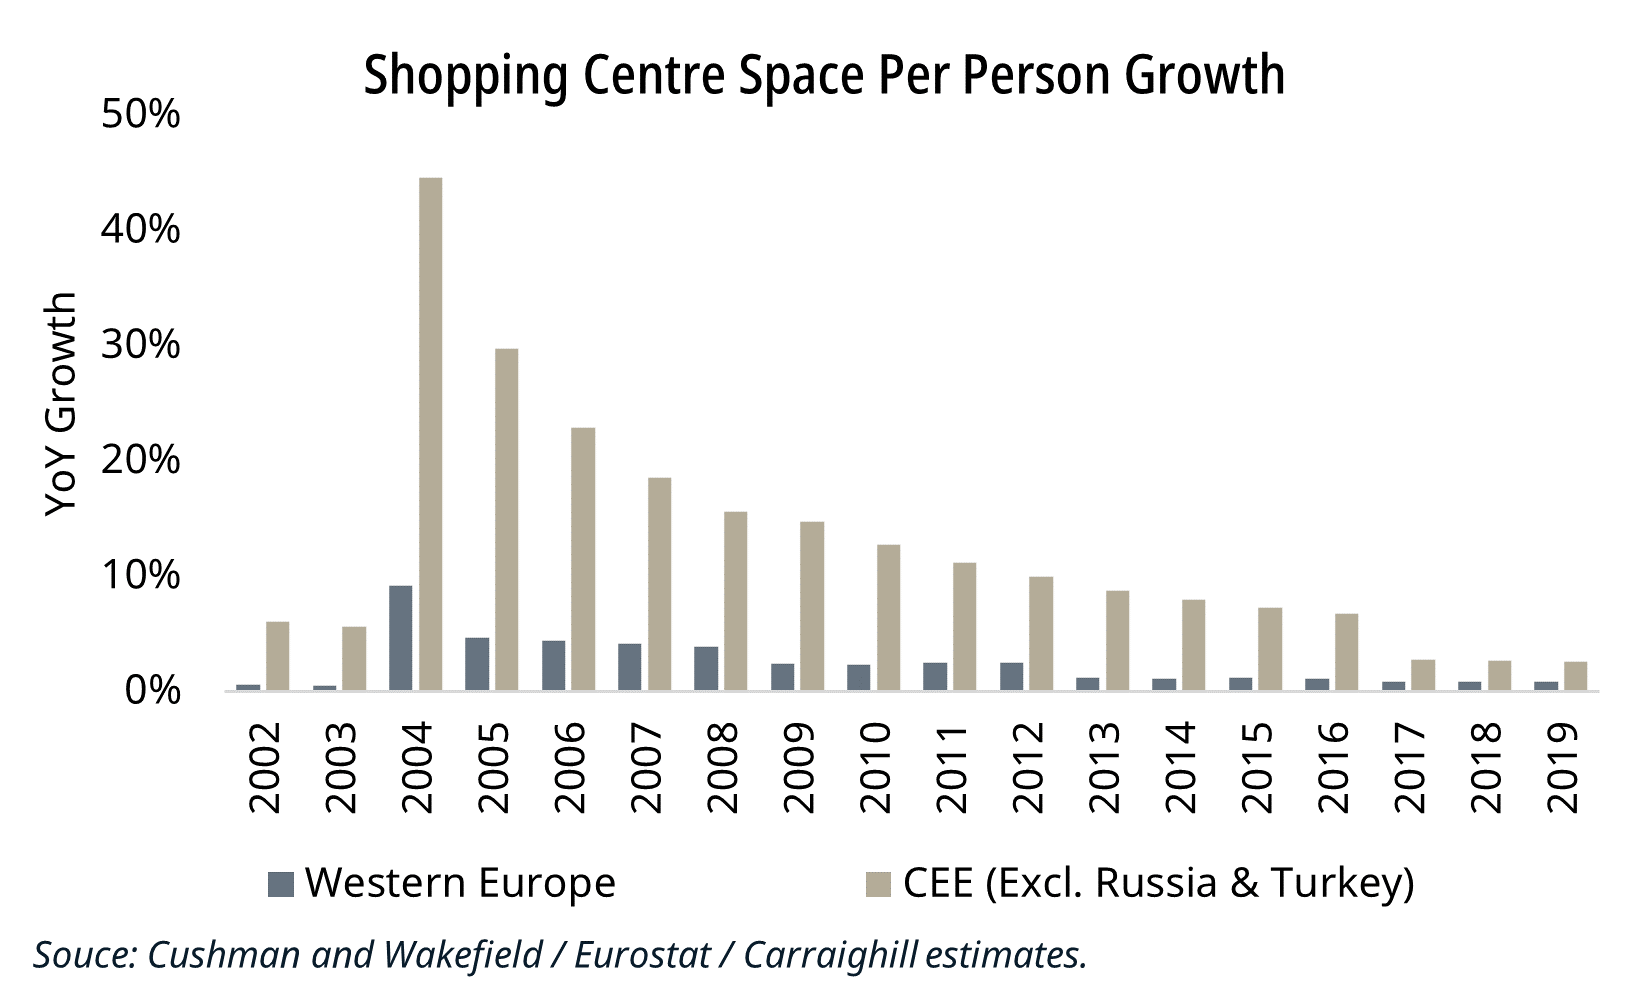
In each country, new space growth has slowed persistently since 2008. It is now a low single-digit level in WE and a low/mid-single percentage in CEE. This may be attributed to factors including changed financing conditions, rising private sector debt, weakening of GDP per capita, and the accelerating structural challenge presented by the transition online.
Comparing space per person to consumption per person
The nominal level of consumer spending has tended to rise persistently, supported by central banks and governments alike. This reflects households’ high 50-60% contribution to GDP each year. Although the pace of consumption growth may have decelerated globally, fiscal policy initiatives continue to provide a major tailwind. We note:
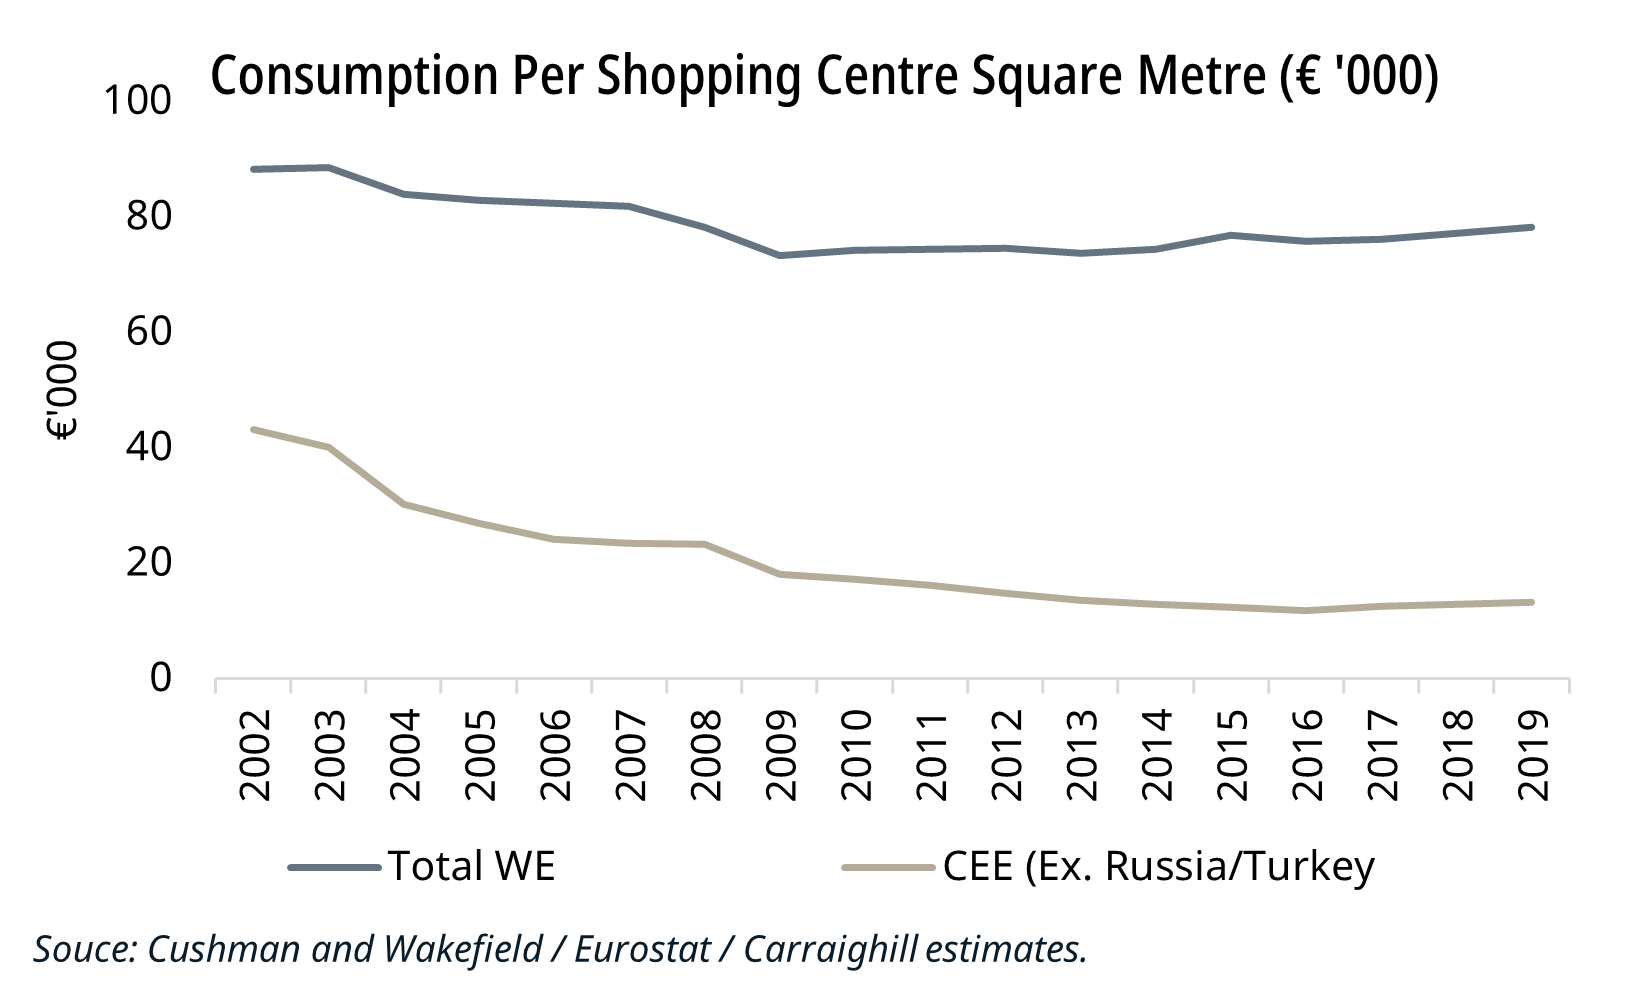
- Consumption per m² highlights the concentration of spending relative to available shopping space. Countries such as Germany, Belgium and the UK have high consumption relative to SC space, indicating less saturation potential. The offset, of course, is that most of these developed nations also have higher online penetration. We also note that higher wealth countries such as Norway, Luxembourg, and Finland have a lower concentration of consumption per m², but this reflects higher levels of household savings and lower levels of discretionary spending in these regions. Each region has unique characteristics.
- In WE, consumption per m² has steadily declined over the last decade. This means that SC square footage has expanded faster than consumption. For example, in 2002, the annual spend per m² was £98,000 in the UK. This is now £92,000 (-5%). This does not augur well for the potential return on new developments.
- In CEE, this is more concerning as the spend per m² is only €13,000. The average consumption per person is €7,900 in 2019, compared to €20,000 in WE.
The transition online
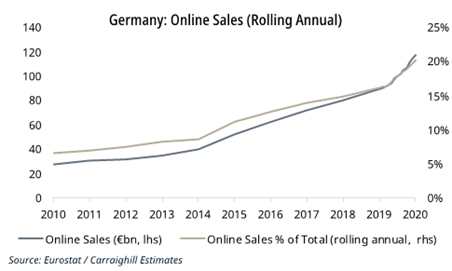
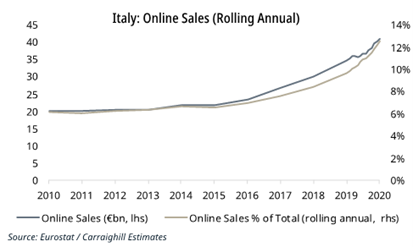
Carraighill has developed its own estimate of online sales in €m. This helps us to directly link spend to rental expectations in our REIT models (survey and index-based measures can be complicated). The onset of the COVID-19 pandemic has accelerated the already structural movement to online retail. France, Germany, and Spain now have over 20% total retail sales through an e-commerce platform. Italy is slower to adjust, with 88% of sales still occurring in-store. This may reflect its older demographic profile.
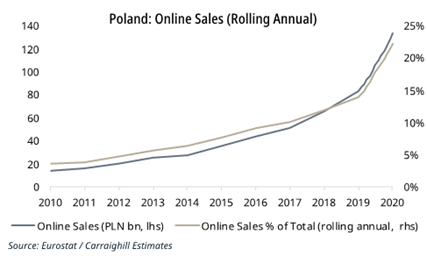
A similar trend is evident in the non-Euro countries. For example, in the UK and Poland, online sales now account for over 20% of total. Czechia is particularly progressive, with 31% of total online, even before the COVID-19 pandemic (currently 35%). Therefore, government fiscal initiatives have ensured that consumption is stronger than we would initially have envisaged early into the lockdowns. Retail sales have reached pre-pandemic levels in some regions, primarily due to the growth in online sales. Among the seven countries we analyse, Germany and France are the only regions where monthly offline sales have exceeded February levels. This is a challenge for rental growth in European SCs.

If you would like to access the reports mentioned in this article, Carraighill Research Access enables you to access these and other thematic and sectoral research through our secure online portal. If you would like to speak to a partner or analyst on the topics raised in this piece, you can contact us here.
