Falling Money Supply and the Velocity of Money – A Primer Given the Markets Renewed Obsession with Falling M3.
Milton Friedman famously claimed that inflation is always and everywhere a monetary phenomenon. Supporters of this theory contend that in the long run, the supply of money is the key determinant of price levels and that the rate of change in the money supply likewise explains the rate of change in the price level, i.e. inflation.
This equation states that the quantity of money (Q) times the velocity of money (V) equals the general price level (P) times the real output of goods and services in an economy (Y). Both sides must equal nominal GDP, so the equation is an identity.
Q x V = P x Y
This equation has come back into focus more recently, given the sharp fall in M2 growth rates globally, including in the US. We can see from the graph that it is declining at close to the fastest pace on record.
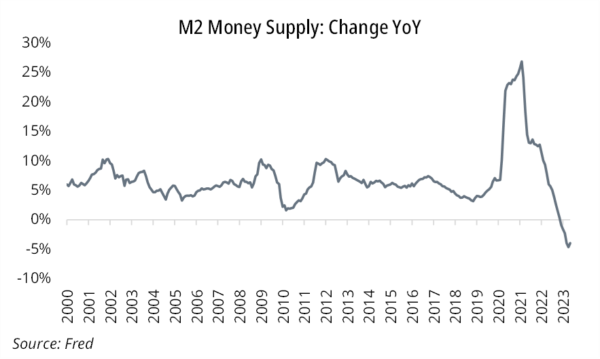
This decline in M2/M3 is influenced in part by higher rates. The level of interest rates in an economy influences credit creation. If loan growth is productive, then this should result in a higher level of wealth per person over time. When an economy becomes too “hot” central banks generally ‘step in’ to control lending, by increasing interest rates. This was initially deemed necessary given the “Covid excesses”. However, many now argue that we are going to have a deflationary depression and the recent decline in M2/M3 is a sign that the economy will slow sharply.
However, instead of having a fall in GDP, economic growth expectations have actually been picking up. The question therefore is why? The answer lies in money velocity.
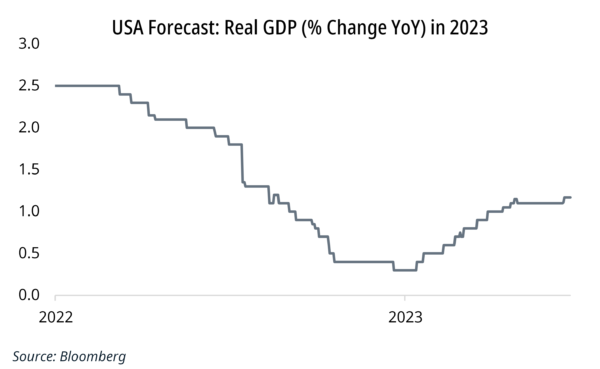
In Milton Friedman’s original statement, he had always assumed a stable velocity of money. Indeed, looking back in history we note:
1. After WW2 money velocity was broadly stable in the USA in a gold standard/ Bretton Woods currency world. This was a period where debt productivity was high.
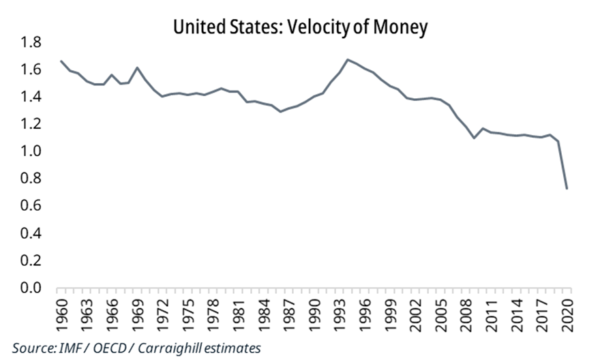
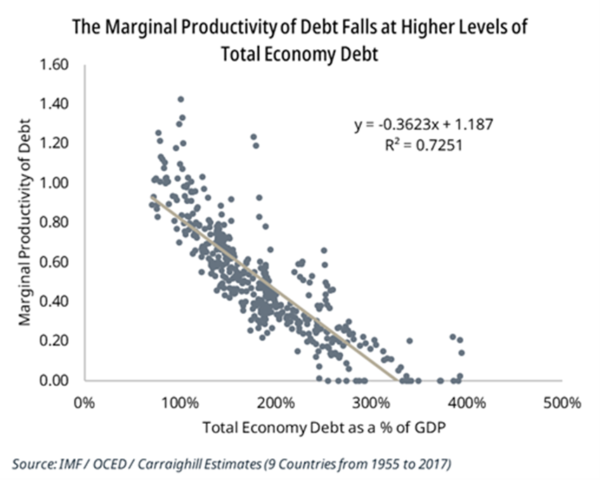
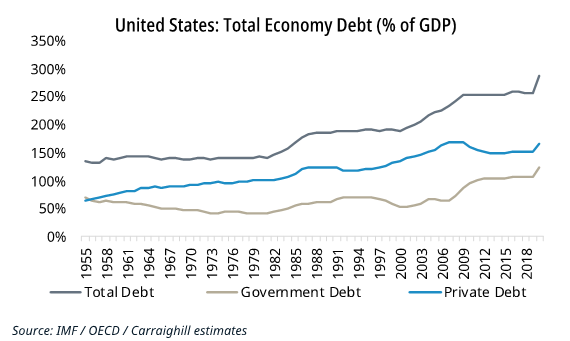
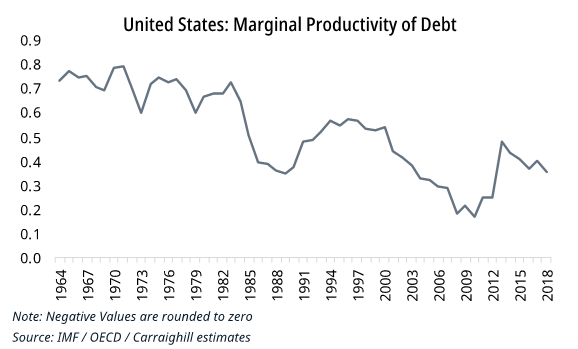
2. However, from 1993-2020 it started to fall. Why? The following graphs show that the marginal productivity of debt falls as total economy debt rises. As total debt in the USA has risen, the productivity of that debt has declined. There is a clearly negative correlation with the level of debt and how productive an economy can be.
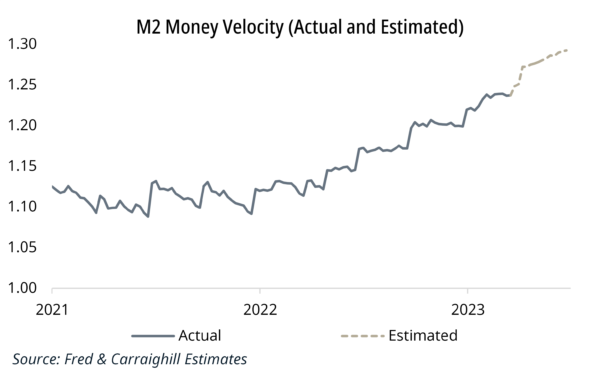
3. 2020-2023: Velocity of money is now rising sharply again: From its pandemic era trough, it increased from 1.06 to 1.24 as of the middle of March 2023, up 17%. Based on “nowcasts” from the Cleveland and Atlanta Fed, Carraighill has created its own internal “fast” weekly estimate. Plugging in the numbers, we see that the expectation is for a further increase to 1.29 by the end of Q2 (see last graph).
We believe the velocity of money has picked up for two reasons:
- Excess spending of pandemic related issues: The most common-sense way to think of why the velocity of money has increased is that American consumers have taken money out of their bank accounts post pandemic and spent it while American businesses took their cash and invested it.
- Government policy: The fiscal stance globally has become much more accommodative as politicians seek to stem the impact of each crisis (from higher energy bills to climate change).
So, what will the velocity of money do next? Well, M2 is falling largely because of the Fed’s policy of quantitative tightening and falling loan demand. Its balance sheet has therefore been reduced in size. Indeed, it has now sold $490bn worth of securities since they last injected liquidity post the SVB collapse. We expect this to continue.
However, in the short term our view remains that excess consumer demand persists in the economy from the pandemic years, which still must work its way through the system. With excessively loose fiscal policy, it is therefore not clear that money velocity has peaked. Indeed, our own internal measure of household discretionary spending power agrees with this assessment (see prior posts).
This really is a time where we need to keep on top of the data. Most economists continue to suggest that we are at peak interest rates. If velocity continues at this level, we are less sure, but clearly remain open minded to that possibility.
If you would like to access our work, Carraighill Research Access enables you to access these and other thematic and sectoral research through our secure online portal. It also gives you access to investment ideas across the banks, payments, fintech, asset management, and real estate sectors for European and select emerging markets. If you would like to speak to a partner or analyst on the topics raised in this piece, you can contact us here.


